Finding a gas-bubble resonance
Locate the strongest echo from a spherical gas inclusion, then resolve its peak with a narrower frequency sweep. The model treats both fluids as lossless and the finite resonance width comes from acoustic radiation.
Search, then zoom in
using AcousticScattering
using CairoMakie: Label, WilkinsonTicks, plot, save

body = Sphere(0.001)
sound_speed = 1500.0
gas = GasFilled(1.2 / 1000, 343.0 / sound_speed)
solve(k) = modal(body, gas, k)
search = frequency_sweep(solve, range(1000.0, 6000.0; length=201), sound_speed)
peak = search.frequencies[argmax(search.target_strength)]
band = range(0.9peak, 1.1peak; length=401)
zoom = frequency_sweep(solve, band, sound_speed)

figure = plot(search, zoom; legend=false, figure=(size=(920, 560),),
    axis=(xticks=WilkinsonTicks(4),))
Label(figure[0, 1], "Broad search: 1 mm gas bubble"; tellwidth=false)
Label(figure[0, 2], "Resolved resonance"; tellwidth=false)
save("bubble_resonance.png", figure)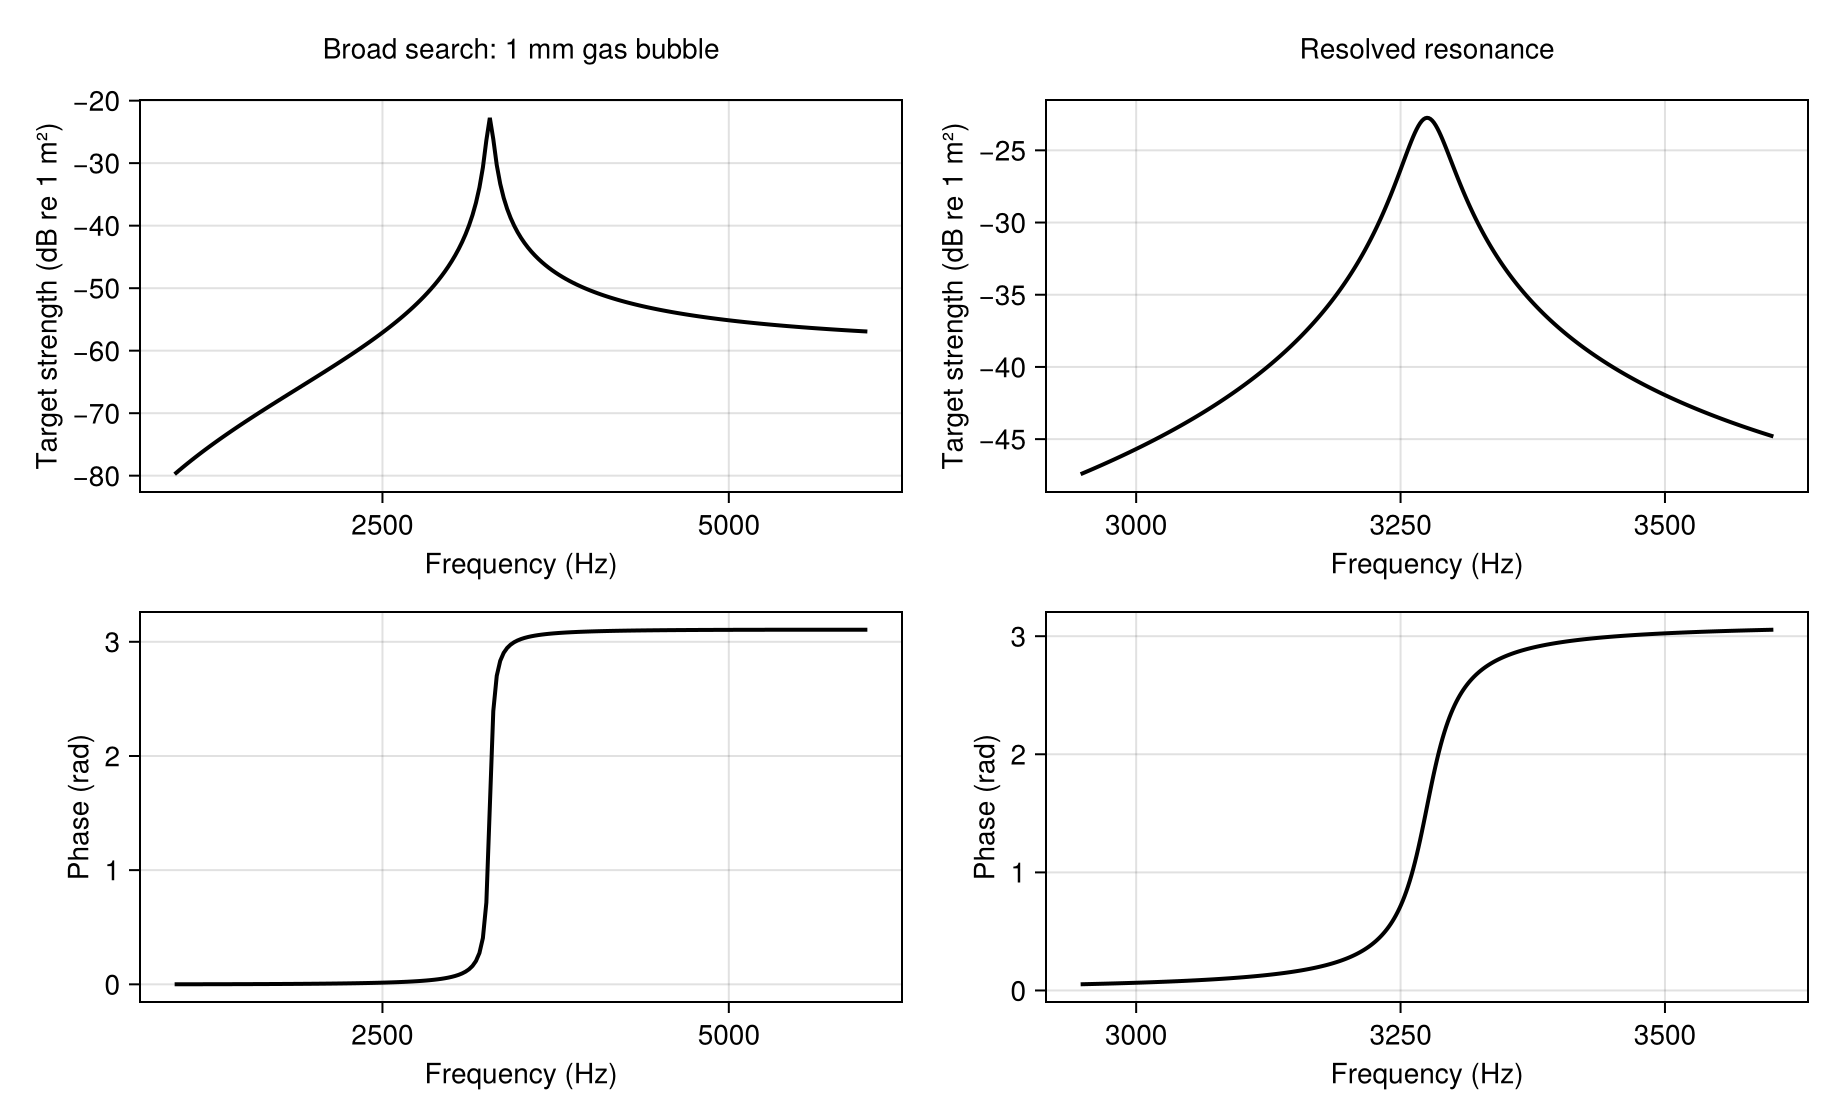
The upper panels show target strength. The lower panels show wrapped amplitude phase in radians. Replot either saved sweep with plot(zoom; quantity=:magnitude) to see amplitude in meters without solving again. Phase follows the package's time convention.
Check the peak location
refined = frequency_sweep(solve,
    range(first(band), last(band); length=801), sound_speed)
f_peak = zoom.frequencies[argmax(zoom.target_strength)]
f_refined = refined.frequencies[argmax(refined.target_strength)]
@assert abs(f_peak-f_refined) <= step(band)
(peak_hz=f_refined, frequency_step_hz=step(band)/2)
(peak_hz = 3275.0, frequency_step_hz = 0.8187500000000005)A sampled peak has finite frequency resolution. Repeat the search when changing radius or material, and widen the band if the maximum lies at an endpoint. For layered inclusions, continue with Coated particles.