See inside a coupled body
The solid gas cavity is drawn first. The complete outer-body wireframe is drawn second so it visibly encloses the cavity instead of allowing the cavity to paint over it. The long axis is x, width is y, and height is z.
using AcousticScattering
using CairoMakie: plot, save

surfaces = [
    mesh(; semiaxes=(0.10, 0.018, 0.025), resolution=0.32, tip_ratio=0.4, qorder=5),
    mesh(; semiaxes=(0.025, 0.006, 0.009), center=(0.01, 0.003, 0.0),
        rotation=(axis=(0, 0, 1), angle=deg2rad(10)), resolution=0.32,
        tip_ratio=0.4, qorder=5)]
solution = bem(surfaces, [FluidFilled(1.04, 1.04), GasFilled(0.00129, 0.23)],
    2pi * 2250 / 1477.4; parents=[0, 1], incidence_angle=pi / 2)
fig = plot(solution; kind=:mesh, interfaces=[2, 1], wireframe_interfaces=[1],
    interface_colors=[:steelblue, :darkorange],
    interface_labels=["Gas cavity", "Outer body"],
    figure=(size=(1100, 600), figure_padding=(70, 30, 20, 20)),
    axis=(xlabel="x (m)", ylabel="y (m)", zlabel="z (m)",
        azimuth=-0.38pi, elevation=0.22pi))
save("nested.png", fig)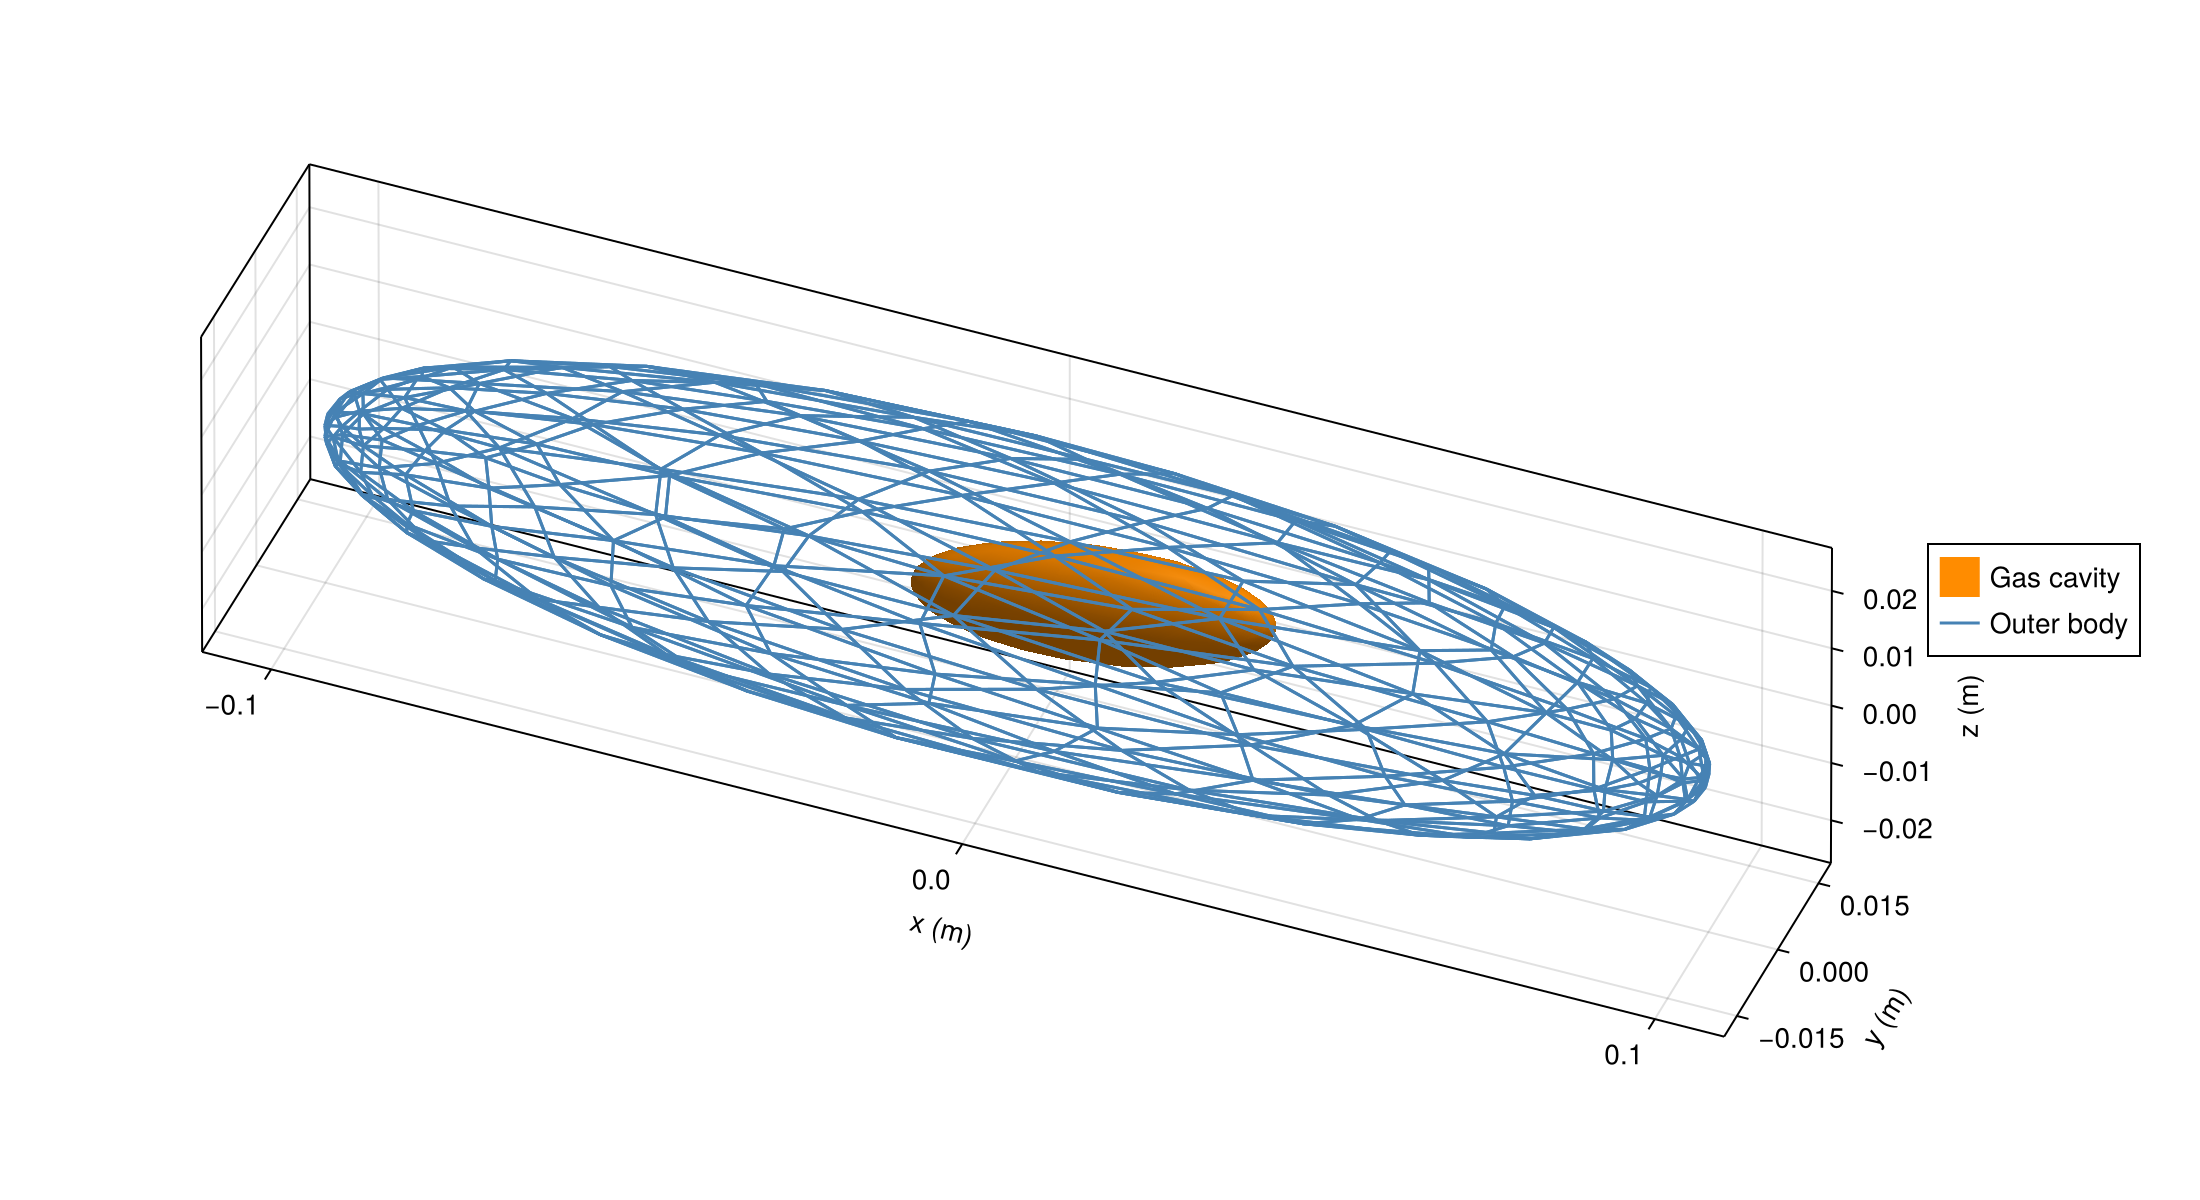
Use target_strength(solution) for the coupled response. The fish tutorial compares coupled and isolated components and checks refinement.
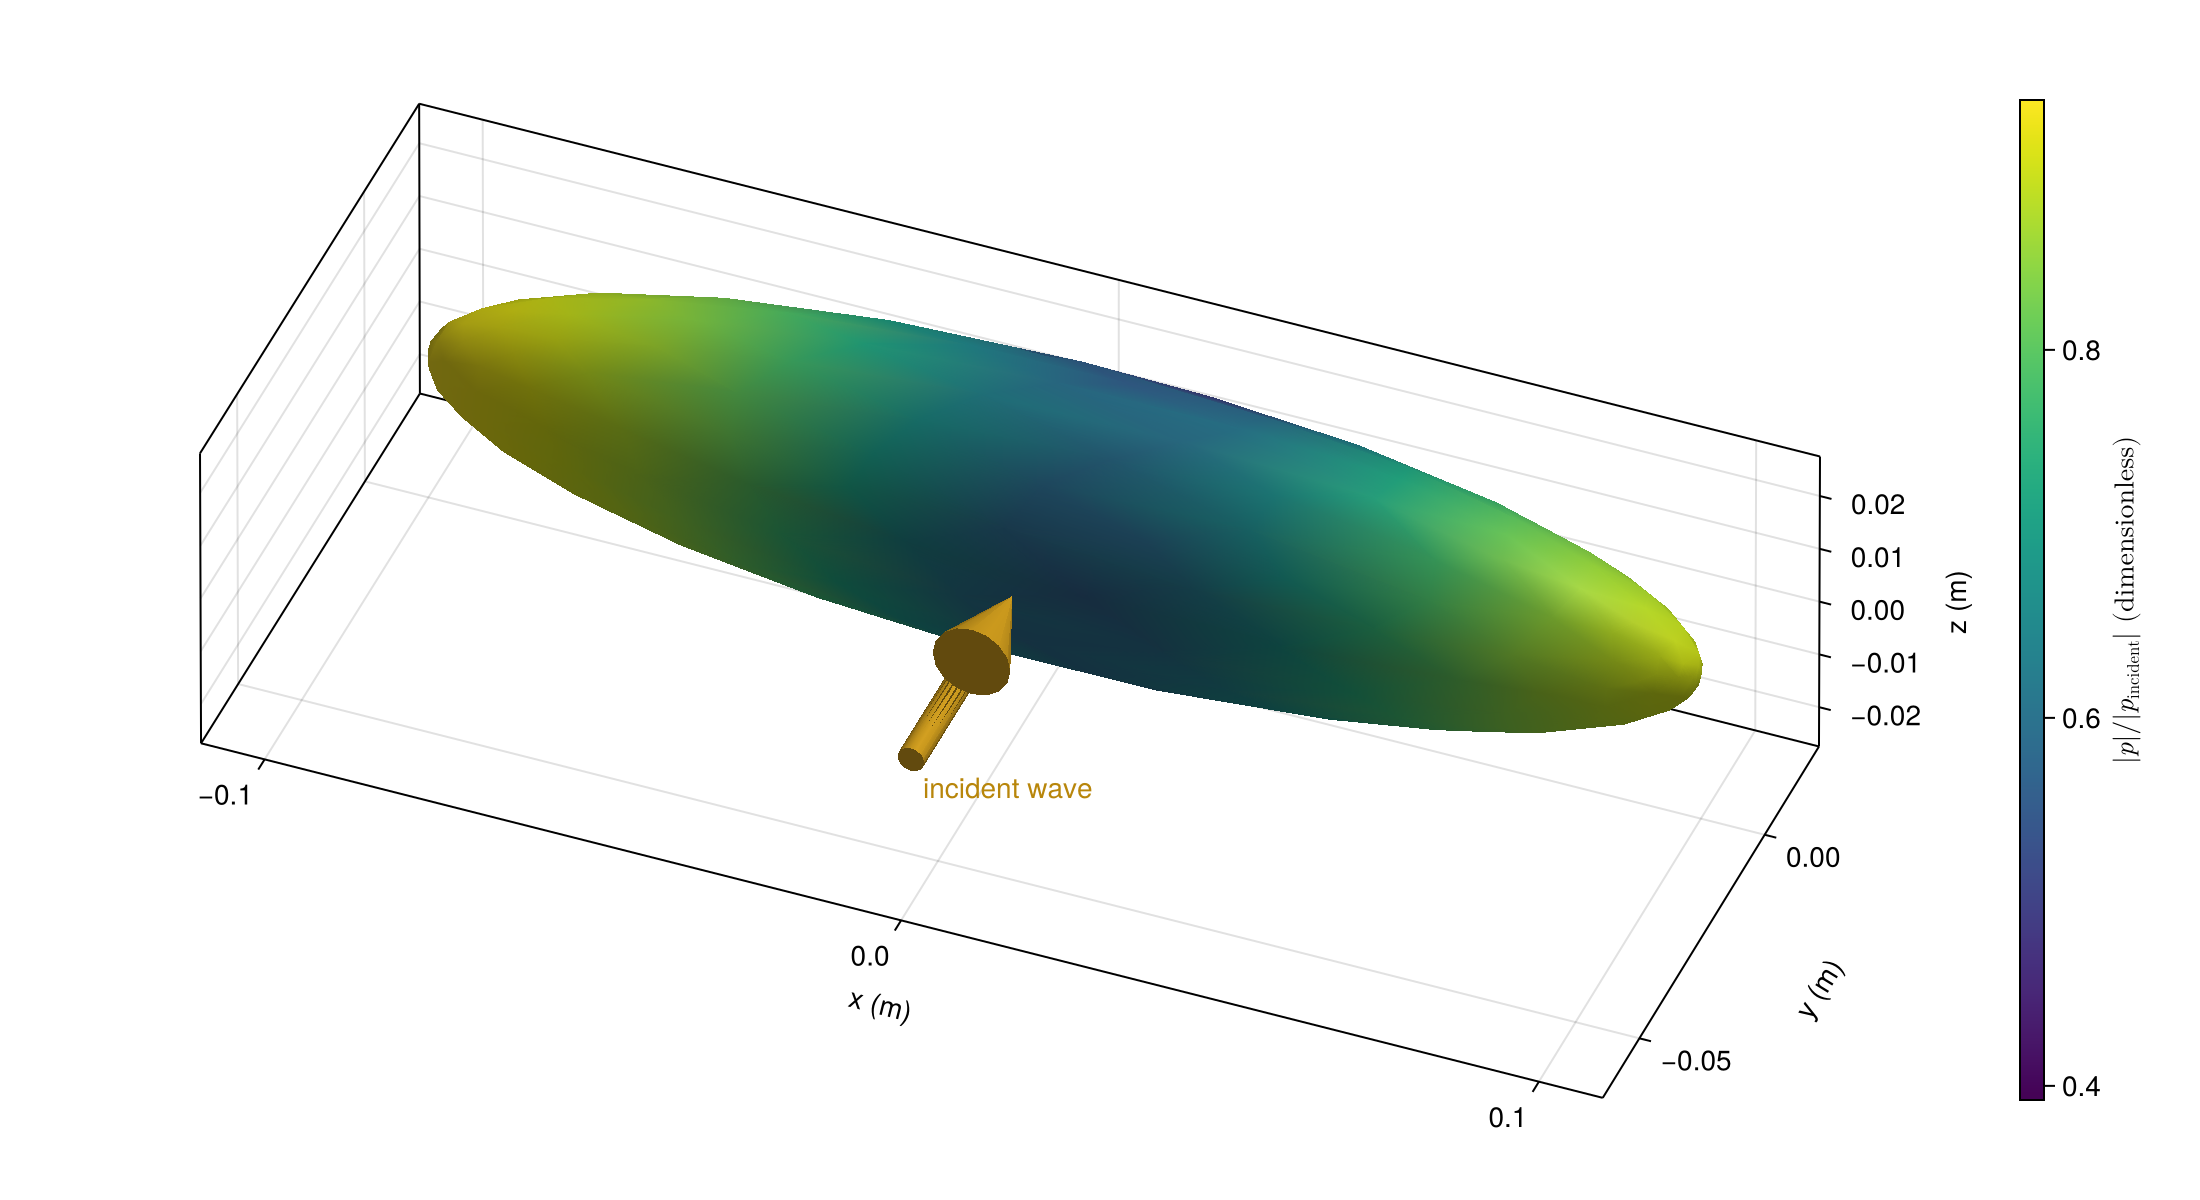
Pressure on the outer body
Color the complete outer interface by total pressure magnitude. This separate figure shows only the coupled trace on interface 1, not the gas-cavity surface. The gold arrow marks the incident wave direction.
fig = plot(solution; kind=:surface_field, interfaces=[1],
    colormap=:viridis, incident_arrow=true,
    figure=(size=(1100, 600), figure_padding=(70, 30, 20, 20)),
    axis=(xlabel="x (m)", ylabel="y (m)", zlabel="z (m)",
        azimuth=-0.38pi, elevation=0.22pi))
save("nested_pressure.png", fig)